Explore the most comprehensive and up-to-date Postcode Lottery statistics. Discover hidden patterns and trends through our tables and charts, analysing the following key parameters with regards to the Winning Postcodes:
Appearance frequency.
Most and least frequent postcodes.
Most and least overdue postcodes.
ℹ️ Detailed explanation of our statistics
The statistics on this page are based on an independent analysis of publicly available results by LottoCracked. They are not affiliated with, sponsored, approved, or endorsed by any official lottery authority, operator or promoter.
Select the Number of Postcodes you wish to analyse
↓
Last 5000 postcodes
Last 2500 postcodes
Last 1000 postcodes
Last 500 postcodes
Last 100 postcodes
Last 50 postcodes
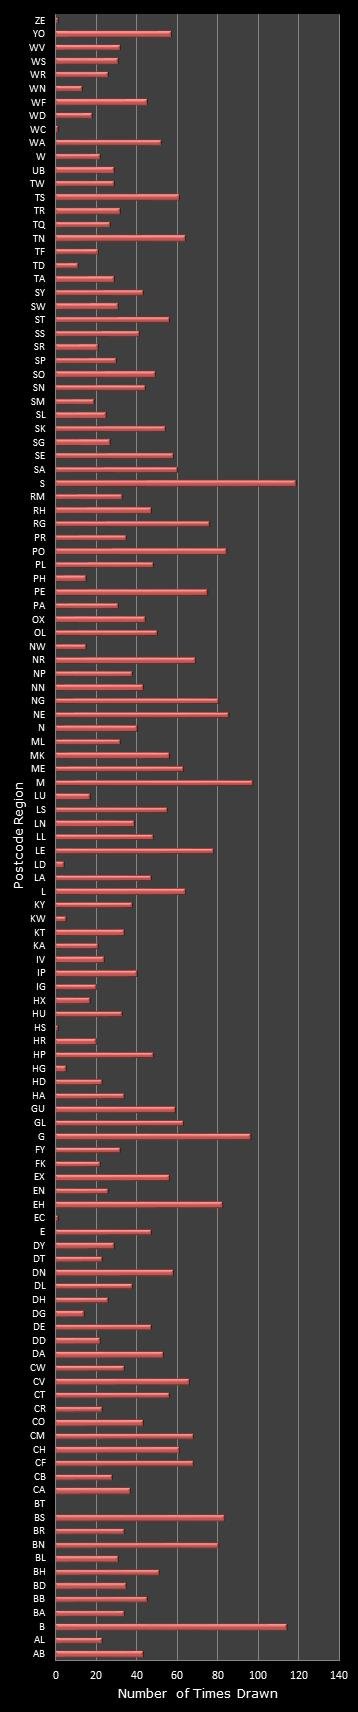
📊 Last 5000 postcodes Number of times drawn - Winning postcodes
Winning postcodes - Statistics
Most picked Least picked Most overdue Least overdue Postcode Freq. Postcode Freq. Postcode Draws Postcode Draws S 118 BT 0 BT 5000 YO 0 B 114 EC 1 ZE 3629 BH 1 M 97 HS 1 HS 2569 BS 3 G 96 WC 1 HG 2041 CW 4 NE 85 ZE 1 KW 1949 EN 5 PO 84 LD 4 PH 1772 GU 6 BS 83 HG 5 IG 995 KT 7 EH 82 KW 5 WC 908 LS 8 BN 80 TD 11 AL 508 NR 10 NG 80 WN 13 TW 504 PE 11
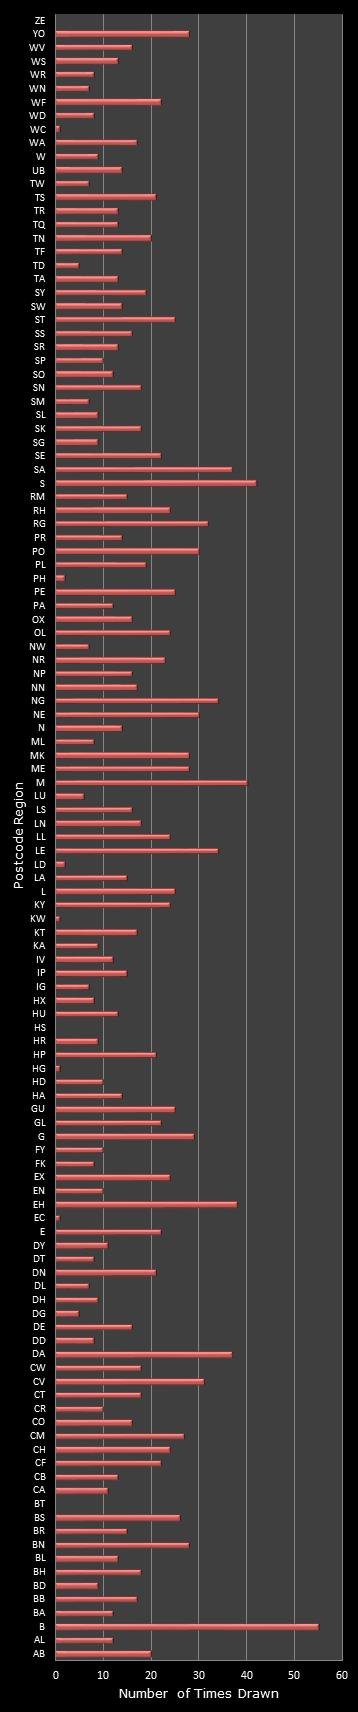
📊 Last 2500 postcodes Number of times drawn - Winning postcodes
Winning postcodes - Statistics
Most picked Least picked Most overdue Least overdue Postcode Freq. Postcode Freq. Postcode Draws Postcode Draws B 55 BT 0 BT 2000 YO 0 S 42 HS 0 HG 2000 BH 1 M 40 ZE 0 HS 2000 BS 3 EH 38 EC 1 ZE 2000 CW 4 DA 37 HG 1 KW 1949 EN 5 SA 37 KW 1 PH 1772 GU 6 LE 34 WC 1 IG 995 KT 7 NG 34 LD 2 WC 908 LS 8 RG 32 PH 2 AL 508 NR 10 CV 31 DG 5 TW 504 PE 11
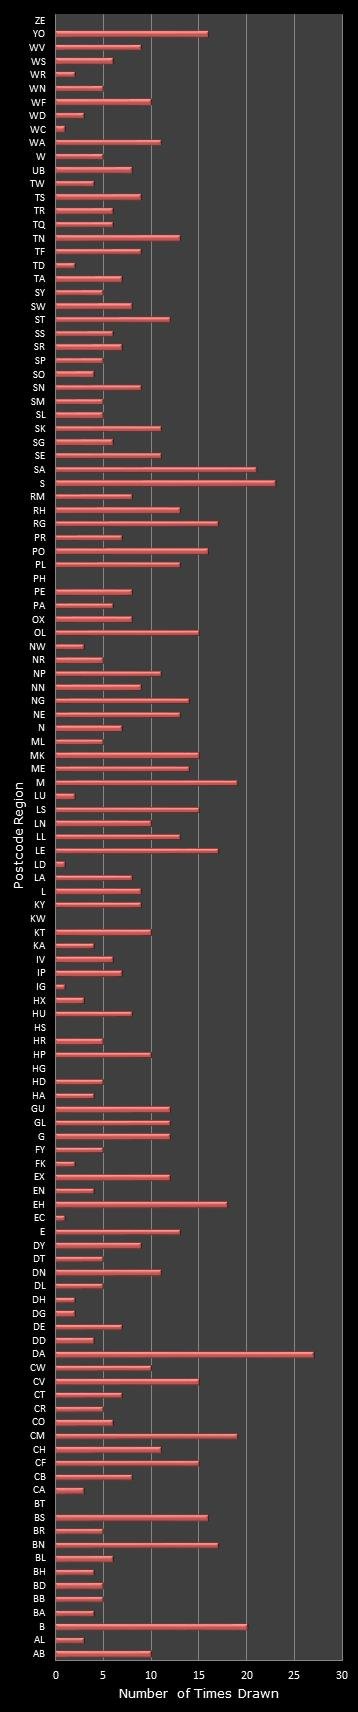
📊 Last 1000 postcodes Number of times drawn - Winning postcodes
Winning postcodes - Statistics
Most picked Least picked Most overdue Least overdue Postcode Freq. Postcode Freq. Postcode Draws Postcode Draws DA 27 BT 0 BT 1000 YO 0 S 23 HG 0 HG 1000 BH 1 SA 21 HS 0 HS 1000 BS 3 B 20 KW 0 KW 1000 CW 4 CM 19 PH 0 PH 1000 EN 5 M 19 ZE 0 ZE 1000 GU 6 EH 18 EC 1 IG 995 KT 7 BN 17 IG 1 WC 908 LS 8 LE 17 LD 1 AL 508 NR 10 RG 17 WC 1 TW 504 PE 11
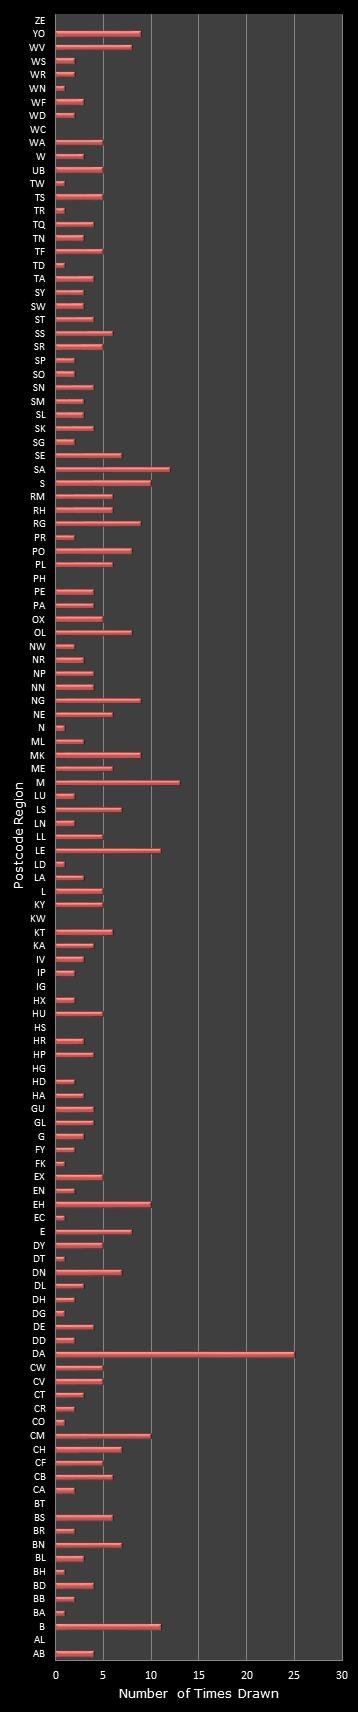
📊 Last 500 postcodes Number of times drawn - Winning postcodes
Winning postcodes - Statistics
Most picked Least picked Most overdue Least overdue Postcode Freq. Postcode Freq. Postcode Draws Postcode Draws DA 25 AL 0 AL 500 YO 0 M 13 BT 0 BT 500 BH 1 SA 12 HG 0 HG 500 BS 3 B 11 HS 0 HS 500 CW 4 LE 11 IG 0 IG 500 EN 5 CM 10 KW 0 KW 500 GU 6 EH 10 PH 0 PH 500 KT 7 S 10 WC 0 TW 500 LS 8 MK 9 ZE 0 WC 500 NR 10 NG 9 BA 1 ZE 500 PE 11
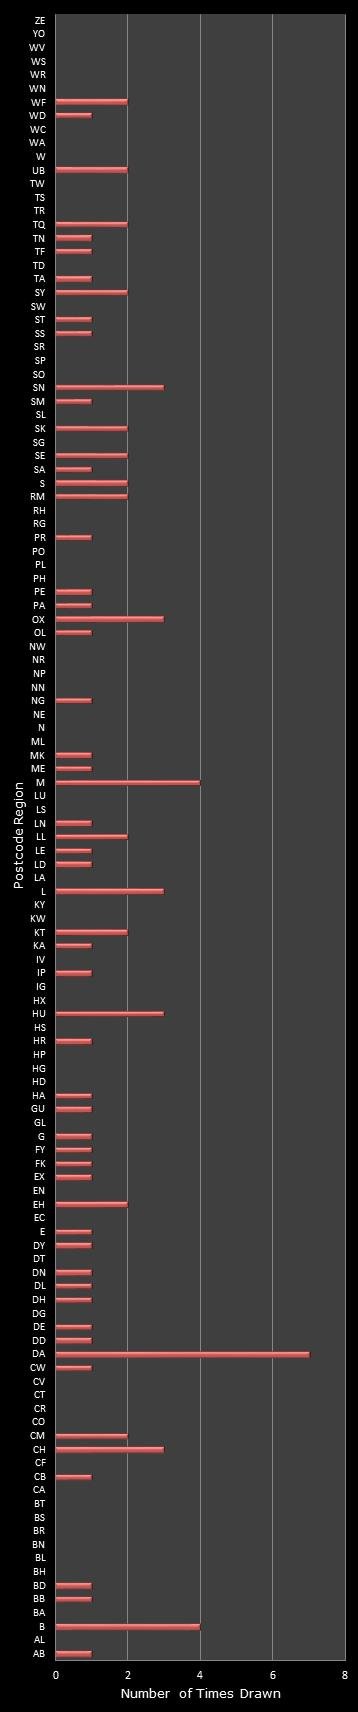
📊 Last 100 postcodes Number of times drawn - Winning postcodes
Winning postcodes - Statistics
Most picked Least picked Most overdue Least overdue Postcode Freq. Postcode Freq. Postcode Draws Postcode Draws DA 7 AL 0 AL 100 YO 0 B 4 BA 0 BA 100 BH 1 M 4 BH 0 BL 100 BS 3 CH 3 BL 0 BN 100 CW 4 HU 3 BN 0 BR 100 EN 5 L 3 BR 0 BT 100 GU 6 OX 3 BS 0 CA 100 KT 7 SN 3 BT 0 CF 100 LS 8 CM 2 CA 0 CO 100 NR 10 EH 2 CF 0 CR 100 PE 11
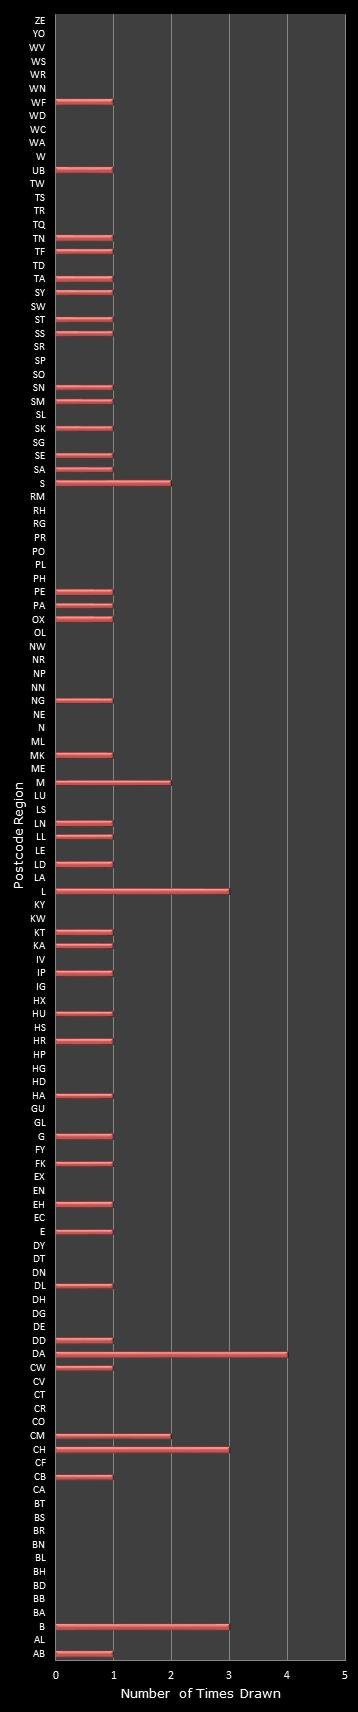
📊 Last 50 postcodes Number of times drawn - Winning postcodes
Winning postcodes - Statistics
Most picked Least picked Most overdue Least overdue Postcode Freq. Postcode Freq. Postcode Draws Postcode Draws DA 4 AL 0 AL 50 YO 0 B 3 BA 0 BA 50 BH 1 CH 3 BB 0 BB 50 BS 3 L 3 BD 0 BD 50 CW 4 CM 2 BH 0 BL 50 EN 5 M 2 BL 0 BN 50 GU 6 S 2 BN 0 BR 50 KT 7 AB 1 BR 0 BT 50 LS 8 CB 1 BS 0 CA 50 NR 10 CW 1 BT 0 CF 50 PE 11
Top Prize £1,000 Weekday Daily Draw