Check out the most comprehensive and up-to-date EuroMillions HotPicks statistics. Discover hidden patterns and trends through our tables and charts, analysing the following key parameters:
Winning combination patterns:
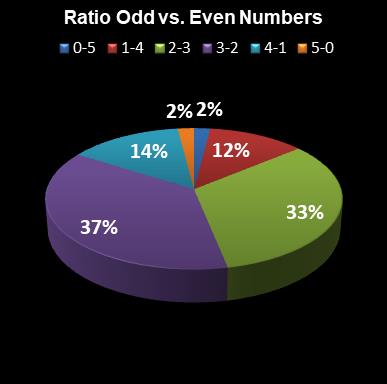
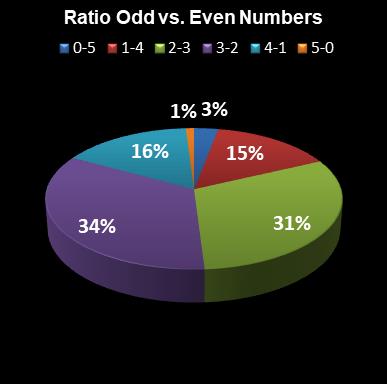
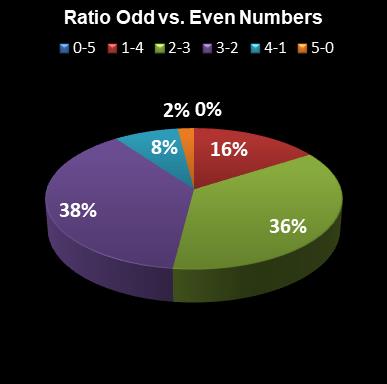
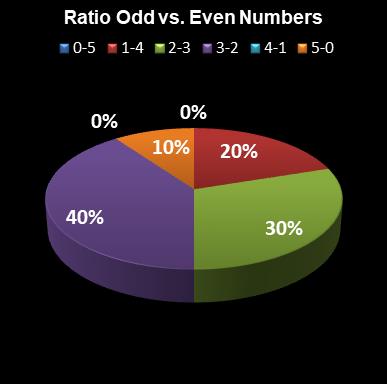
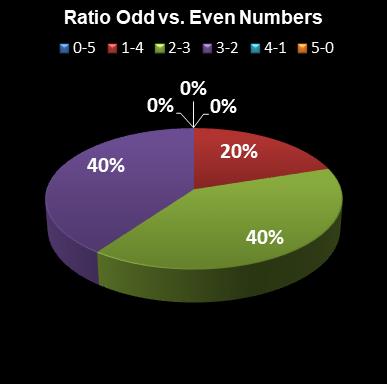
Odd and even numbers.
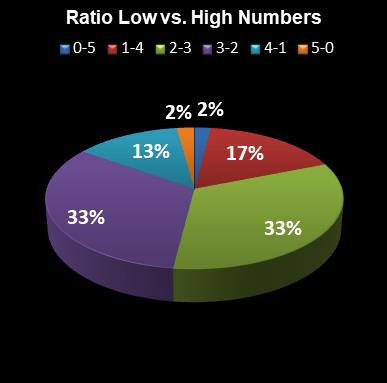
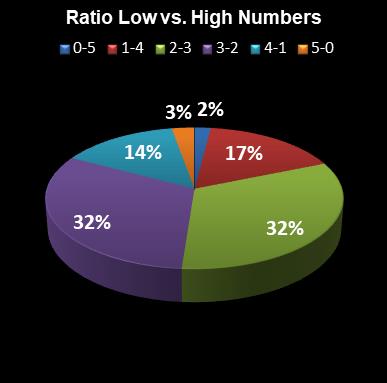
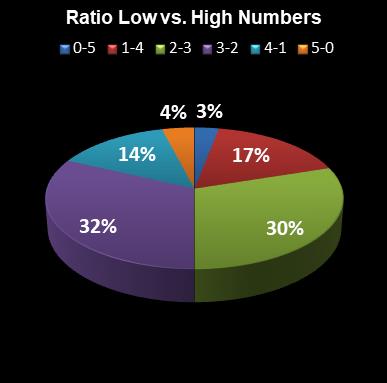
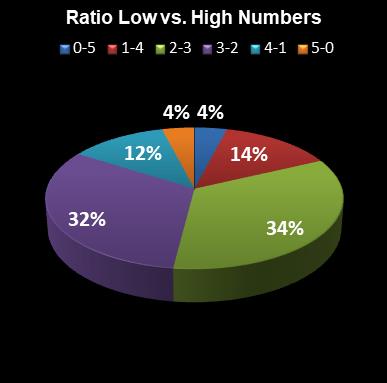
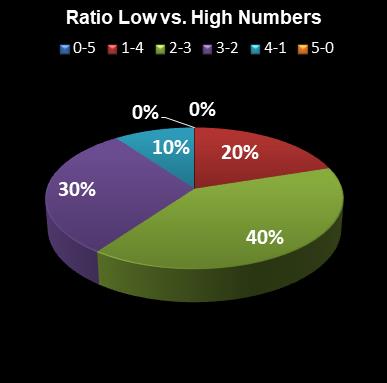
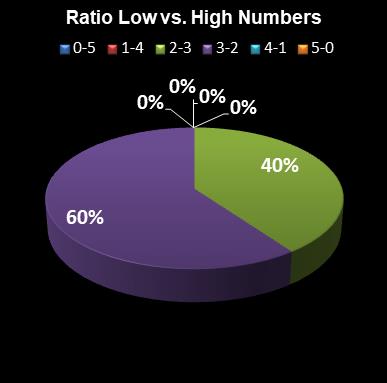
High and low numbers.
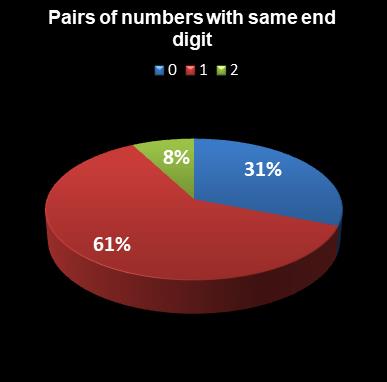
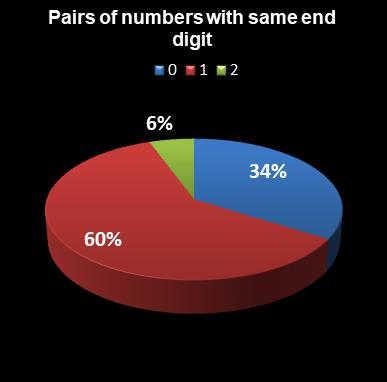
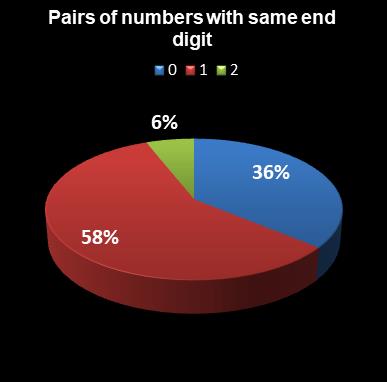
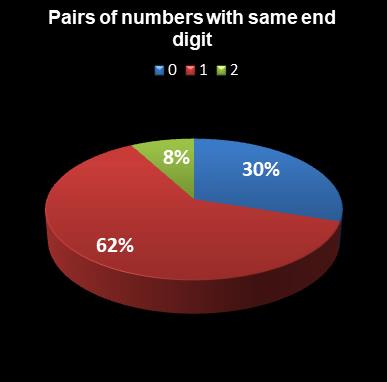
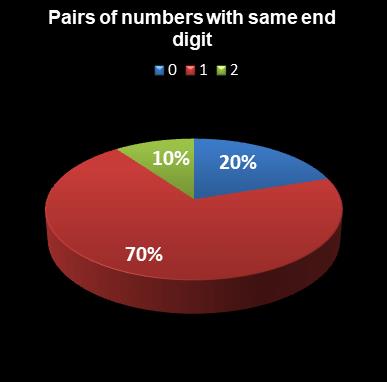
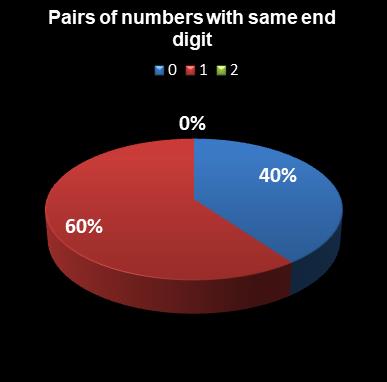
Numbers ending with the same digit.
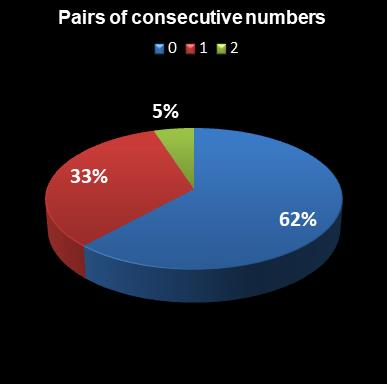
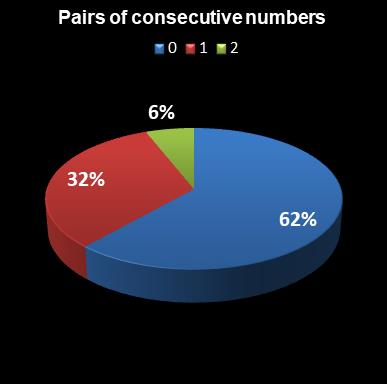
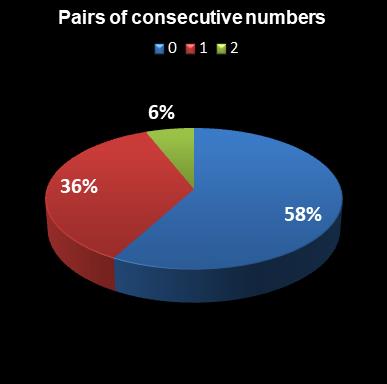
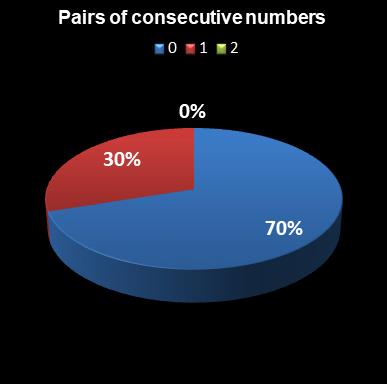
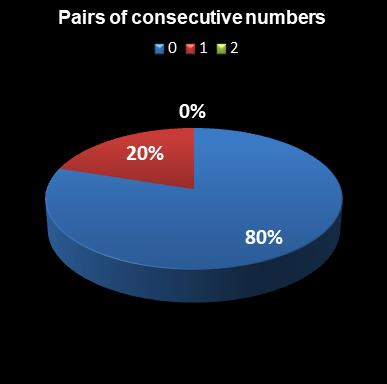
Consecutive numbers.
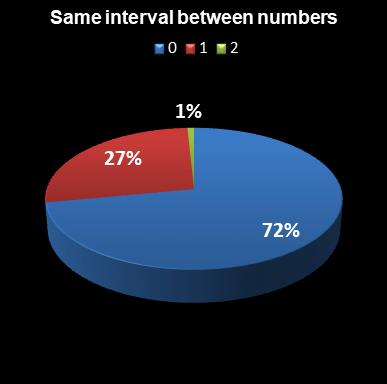
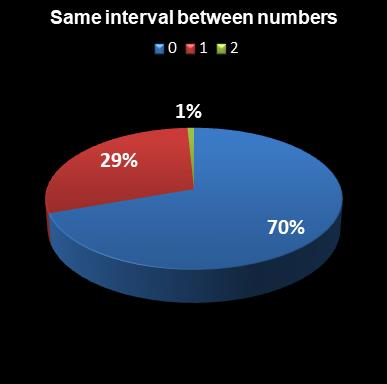
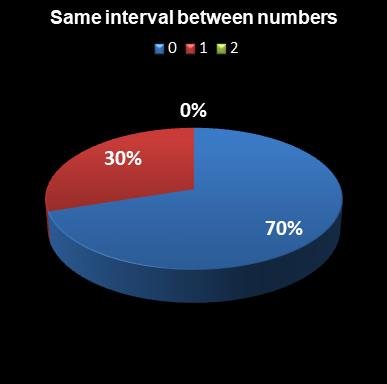
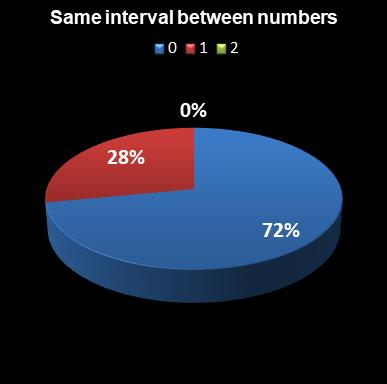
Interval between numbers.
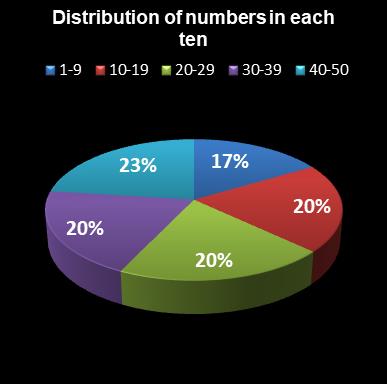
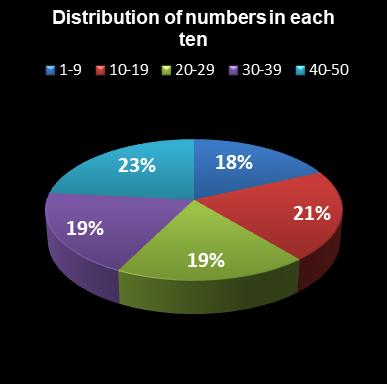
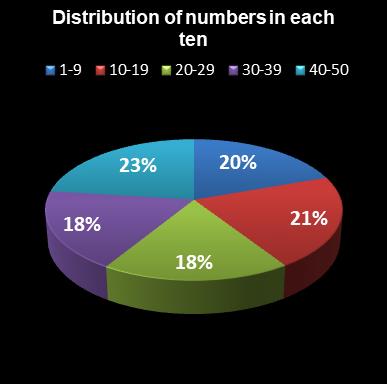
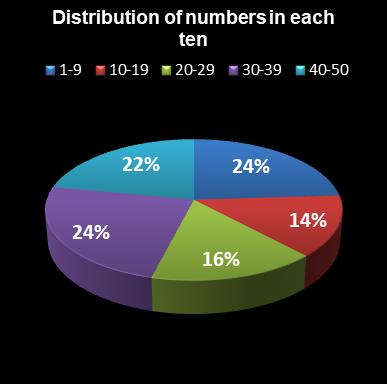
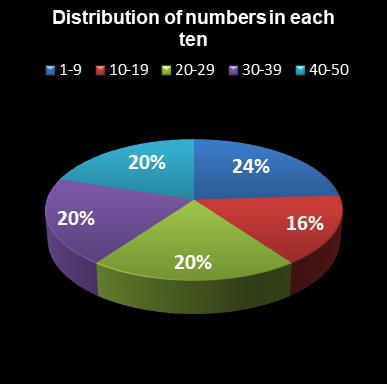
Number distribution in each ten.
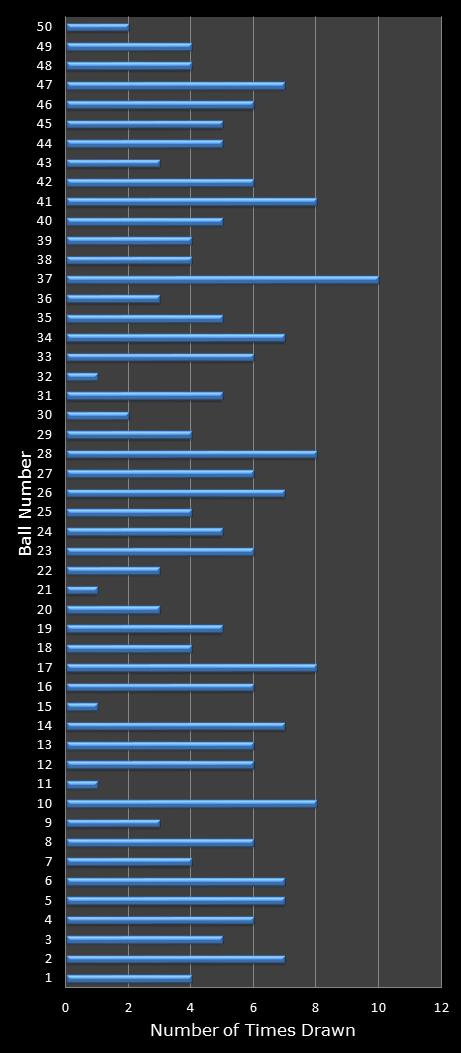
Ball appearance frequency:
Most and least frequent numbers.
Most and least overdue numbers.
Most common pairs of numbers.
Most common pairs of consecutive numbers.
ℹ️ Detailed explanation of our statistics
The statistics on this page are based on an independent analysis of publicly available results by LottoCracked. They are not affiliated with, sponsored, approved, or endorsed by any official lottery authority, operator or promoter.
Select the group of draws you wish to analyse
↓
Last 500 draws
Last 250 draws
Last 100 draws
Last 50 draws
Last 10 draws
Last 5 draws
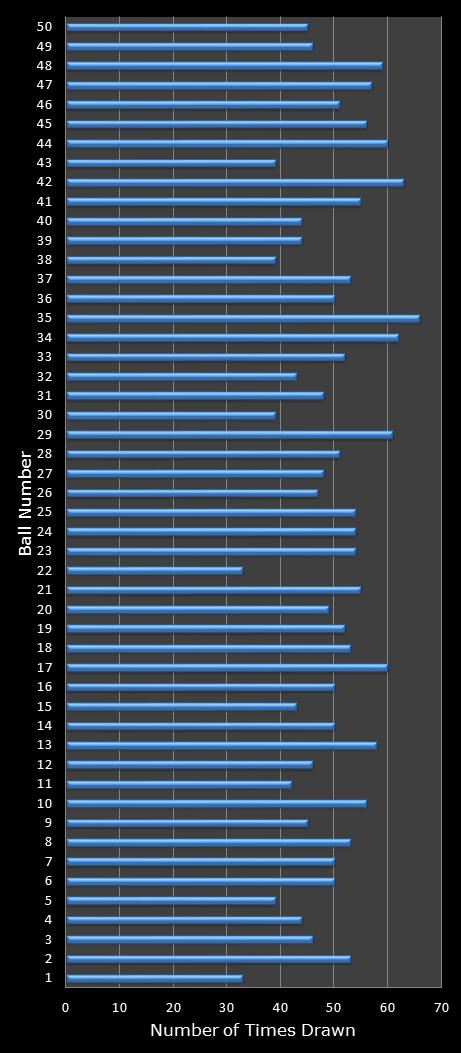
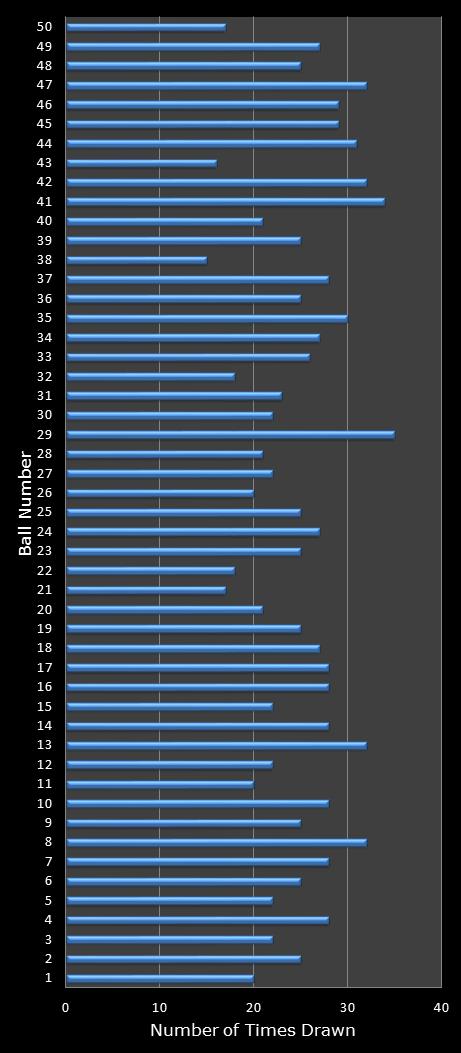
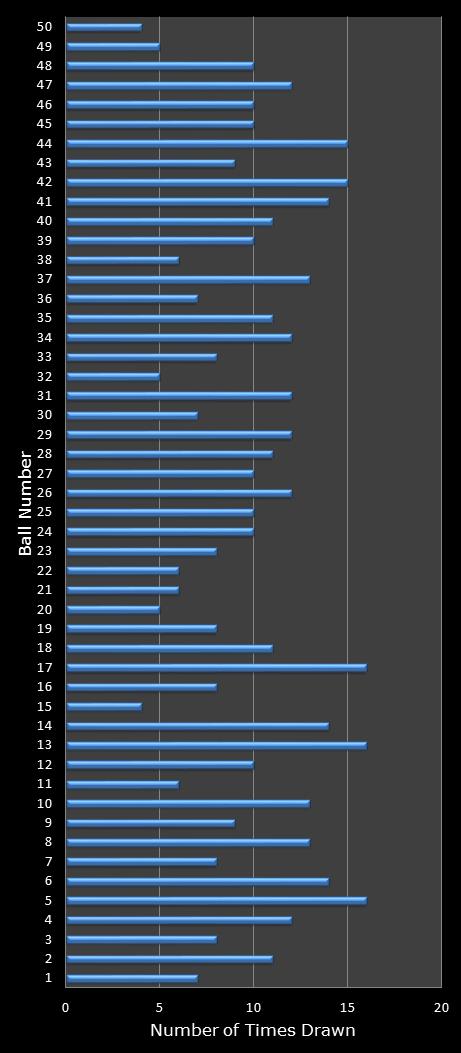
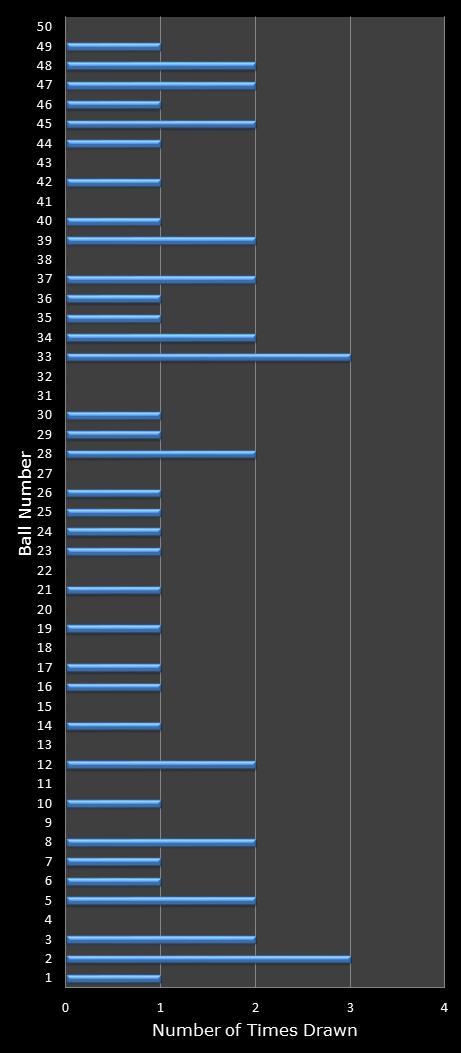
📊 Last 500 draws Number of times drawn - Winning balls
Combination patterns - Statistics
Winning balls - Statistics
Most picked Least picked Most overdue Least overdue Ball Frequency Ball Frequency Ball Draws Ball Draws 35 66 1 33 15 40 5 0 42 63 22 33 50 39 7 0 34 62 5 39 27 32 24 0 29 61 30 39 11 31 30 0 17 60 38 39 13 27 49 0 44 60 43 39 32 21 2 1 48 59 11 42 43 20 3 1 13 58 15 43 20 19 8 1 47 57 32 43 38 19 28 1 10 56 4 44 9 15 39 1
Most common pair Most common consecutive pair Ball 1 Ball 2 Frequency Ball 1 Ball 2 Frequency 35 36 12 35 36 12 23 32 10 23 24 9 10 13 9 47 48 9 23 24 9 16 17 8 47 48 9 22 23 8 6 9 8 41 42 8 11 13 8 17 18 7 16 17 8 20 21 7 16 18 8 26 27 7 22 23 8 34 35 6
📊 Last 250 draws Number of times drawn - Winning balls
Combination patterns - Statistics
Winning balls - Statistics
Most picked Least picked Most overdue Least overdue Ball Frequency Ball Frequency Ball Draws Ball Draws 29 35 38 15 15 40 5 0 41 34 43 16 50 39 7 0 8 32 21 17 27 32 24 0 13 32 50 17 11 31 30 0 42 32 22 18 13 27 49 0 47 32 32 18 32 21 2 1 44 31 1 20 43 20 3 1 35 30 11 20 20 19 8 1 45 29 26 20 38 19 28 1 46 29 20 21 9 15 39 1
Most common pair Most common consecutive pair Ball 1 Ball 2 Frequency Ball 1 Ball 2 Frequency 6 9 7 23 24 6 23 24 6 35 36 6 35 36 6 17 18 5 1 8 5 39 40 5 4 7 5 41 42 5 17 18 5 3 4 4 28 33 5 6 7 4 32 36 5 13 14 4 39 40 5 16 17 4 41 42 5 20 21 4
📊 Last 100 draws Number of times drawn - Winning balls
Combination patterns - Statistics
Winning balls - Statistics
Most picked Least picked Most overdue Least overdue Ball Frequency Ball Frequency Ball Draws Ball Draws 5 16 15 4 15 40 5 0 13 16 50 4 50 39 7 0 17 16 20 5 27 32 24 0 42 15 32 5 11 31 30 0 44 15 49 5 13 27 49 0 6 14 11 6 32 21 2 1 14 14 21 6 43 20 3 1 41 14 22 6 20 19 8 1 8 13 38 6 38 19 28 1 10 13 1 7 9 15 39 1
Most common pair Most common consecutive pair Ball 1 Ball 2 Frequency Ball 1 Ball 2 Frequency 6 9 4 17 18 3 31 37 4 26 27 3 2 12 3 6 7 2 5 14 3 13 14 2 10 13 3 16 17 2 13 24 3 22 23 2 14 38 3 30 31 2 17 18 3 35 36 2 17 19 3 39 40 2 18 31 3 43 44 2
📊 Last 50 draws Number of times drawn - Winning balls
Combination patterns - Statistics
Winning balls - Statistics
Most picked Least picked Most overdue Least overdue Ball Frequency Ball Frequency Ball Draws Ball Draws 37 10 11 1 15 40 5 0 10 8 15 1 50 39 7 0 17 8 21 1 27 32 24 0 28 8 32 1 11 31 30 0 41 8 30 2 13 27 49 0 2 7 50 2 32 21 2 1 5 7 9 3 43 20 3 1 6 7 20 3 20 19 8 1 14 7 22 3 38 19 28 1 26 7 36 3 9 15 39 1
Most common pair Most common consecutive pair Ball 1 Ball 2 Frequency Ball 1 Ball 2 Frequency 28 33 3 16 17 2 31 37 3 17 18 2 2 12 2 22 23 2 6 16 2 46 47 2 7 24 2 1 2 1 10 13 2 2 3 1 12 16 2 3 4 1 16 17 2 5 6 1 17 18 2 6 7 1 17 19 2 13 14 1
📊 Last 10 draws Number of times drawn - Winning balls
Combination patterns - Statistics
Winning balls - Statistics
Most picked Least picked Most overdue Least overdue Ball Frequency Ball Frequency Ball Draws Ball Draws 2 3 4 0 15 40 5 0 33 3 9 0 50 39 7 0 3 2 11 0 27 32 24 0 5 2 13 0 11 31 30 0 8 2 15 0 13 27 49 0 12 2 18 0 32 21 2 1 28 2 20 0 43 20 3 1 34 2 22 0 20 19 8 1 37 2 27 0 38 19 28 1 39 2 31 0 9 15 39 1
Most common pair Most common consecutive pair Ball 1 Ball 2 Frequency Ball 1 Ball 2 Frequency 1 8 1 2 3 1 2 3 1 34 35 1 2 12 1 45 46 1 2 14 1 3 8 1 3 33 1 5 7 1 5 29 1 6 16 1 7 24 1
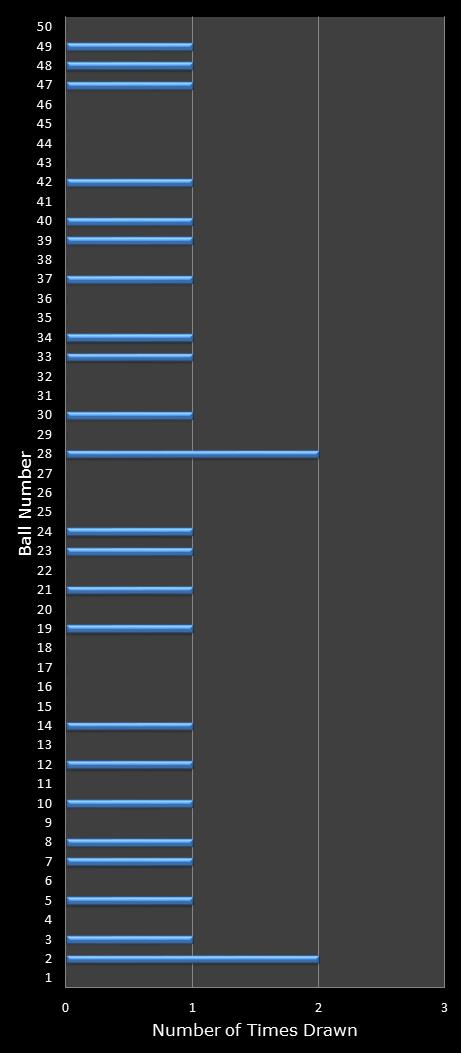
📊 Last 5 draws Number of times drawn - Winning balls
Combination patterns - Statistics
Winning balls - Statistics
Most picked Least picked Most overdue Least overdue Ball Frequency Ball Frequency Ball Draws Ball Draws 2 2 1 0 15 40 5 0 28 2 4 0 50 39 7 0 3 1 6 0 27 32 24 0 5 1 9 0 11 31 30 0 7 1 11 0 13 27 49 0 8 1 13 0 32 21 2 1 10 1 15 0 43 20 3 1 12 1 16 0 20 19 8 1 14 1 17 0 38 19 28 1 19 1 18 0 9 15 39 1
Most common pair Most common consecutive pair Ball 1 Ball 2 Frequency Ball 1 Ball 2 Frequency 2 3 1 2 3 1 2 14 1 3 8 1 5 7 1 7 24 1 8 28 1 10 19 1 12 21 1 14 28 1 19 37 1
HotPicks Top Prize £1,000,000 Friday, 31 July 2026