Explore the most comprehensive and up-to-date Postcode Lottery statistics. Discover hidden patterns and trends through our tables and charts, analysing the following key parameters with regards to the Winning Postcodes:
Appearance frequency.
Most and least frequent postcodes.
Most and least overdue postcodes.
ℹ️ Detailed explanation of our statistics
The statistics on this page are based on an independent analysis of publicly available results by LottoCracked. They are not affiliated with, sponsored, approved, or endorsed by any official lottery authority, operator or promoter.
Select the Number of Postcodes you wish to analyse
↓
Last 5000 postcodes
Last 2500 postcodes
Last 1000 postcodes
Last 500 postcodes
Last 100 postcodes
Last 50 postcodes
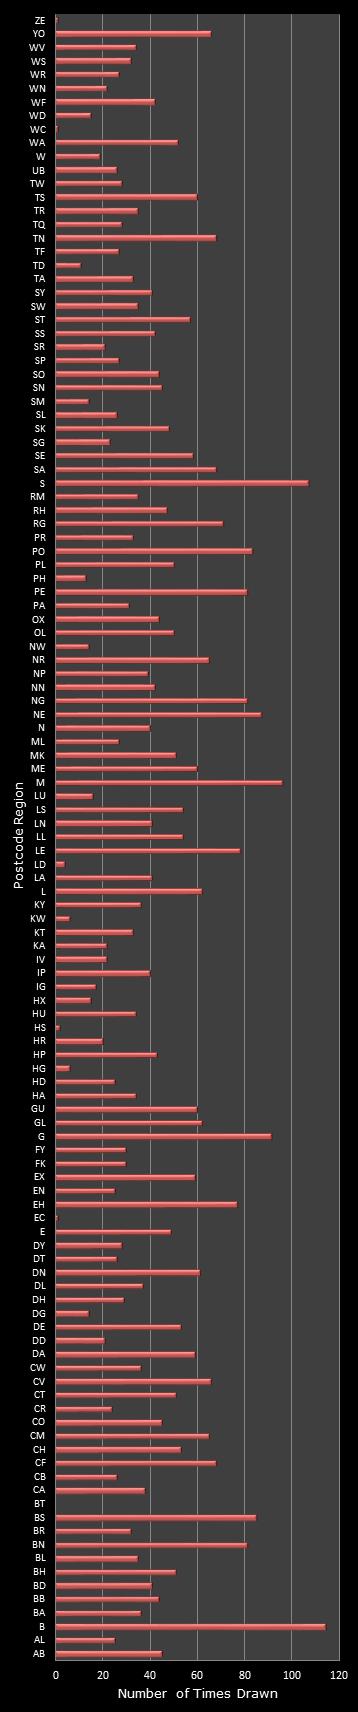
📊 Last 5000 postcodes Number of times drawn - Winning postcodes
Winning postcodes - Statistics
Most picked Least picked Most overdue Least overdue Postcode Freq. Postcode Freq. Postcode Draws Postcode Draws B 114 BT 0 BT 5000 BA 0 S 107 EC 1 EC 929 BH 1 M 96 WC 1 HX 843 BN 2 G 91 ZE 1 ML 831 DA 4 NE 87 HS 2 WD 811 DH 5 BS 85 LD 4 SM 747 EH 6 PO 83 HG 6 LD 737 EX 7 BN 81 KW 6 EN 641 G 8 NG 81 TD 11 PH 627 HD 9 PE 81 PH 13 KW 554 L 10
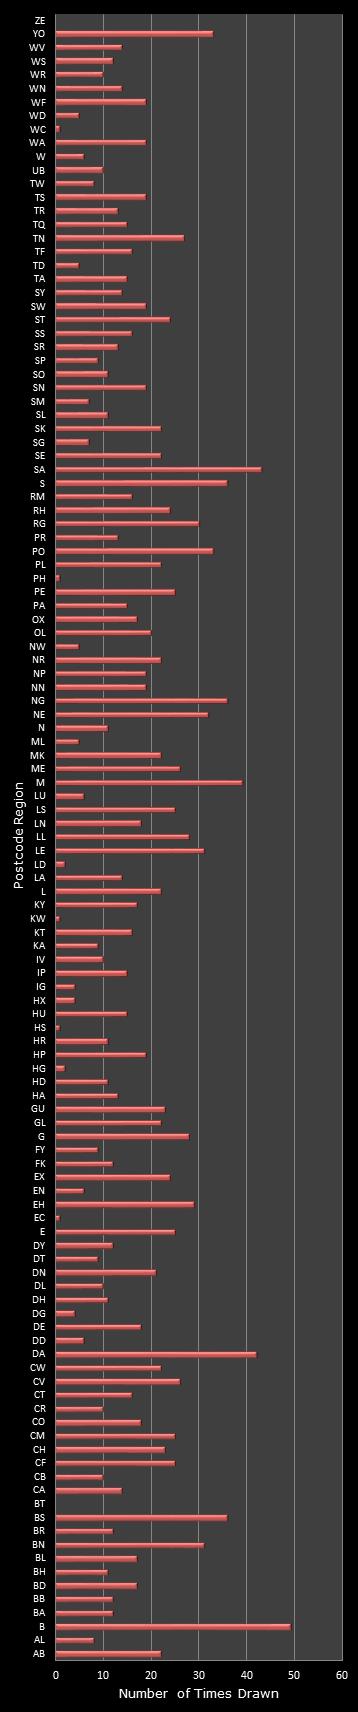
📊 Last 2500 postcodes Number of times drawn - Winning postcodes
Winning postcodes - Statistics
Most picked Least picked Most overdue Least overdue Postcode Freq. Postcode Freq. Postcode Draws Postcode Draws B 49 BT 0 BT 2000 BA 0 SA 43 ZE 0 EC 929 BH 1 DA 42 EC 1 HX 843 BN 2 M 39 HS 1 ML 831 DA 4 BS 36 KW 1 WD 811 DH 5 NG 36 PH 1 SM 747 EH 6 S 36 WC 1 LD 737 EX 7 PO 33 HG 2 EN 641 G 8 YO 33 LD 2 PH 627 HD 9 NE 32 DG 4 KW 554 L 10
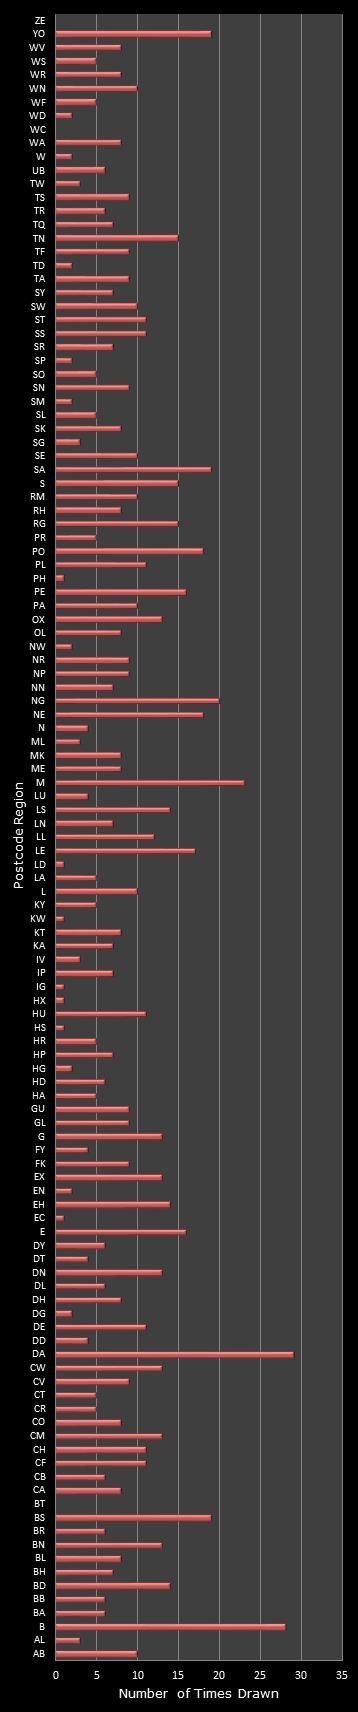
📊 Last 1000 postcodes Number of times drawn - Winning postcodes
Winning postcodes - Statistics
Most picked Least picked Most overdue Least overdue Postcode Freq. Postcode Freq. Postcode Draws Postcode Draws DA 29 BT 0 BT 1000 BA 0 B 28 WC 0 EC 929 BH 1 M 23 ZE 0 HX 843 BN 2 NG 20 EC 1 ML 831 DA 4 BS 19 HS 1 WD 811 DH 5 SA 19 HX 1 SM 747 EH 6 YO 19 IG 1 LD 737 EX 7 NE 18 KW 1 EN 641 G 8 PO 18 LD 1 PH 627 HD 9 LE 17 PH 1 KW 554 L 10
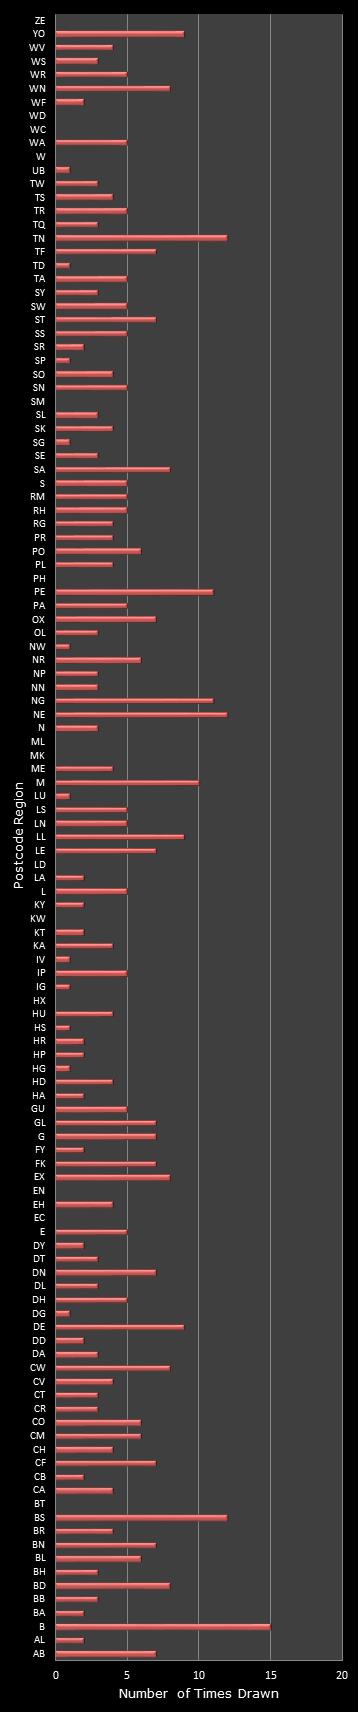
📊 Last 500 postcodes Number of times drawn - Winning postcodes
Winning postcodes - Statistics
Most picked Least picked Most overdue Least overdue Postcode Freq. Postcode Freq. Postcode Draws Postcode Draws B 15 BT 0 BT 500 BA 0 BS 12 EC 0 DG 500 BH 1 NE 12 EN 0 EC 500 BN 2 TN 12 HX 0 EN 500 DA 4 NG 11 KW 0 HG 500 DH 5 PE 11 LD 0 HX 500 EH 6 M 10 MK 0 KW 500 EX 7 DE 9 ML 0 LD 500 G 8 LL 9 PH 0 ML 500 HD 9 YO 9 SM 0 PH 500 L 10
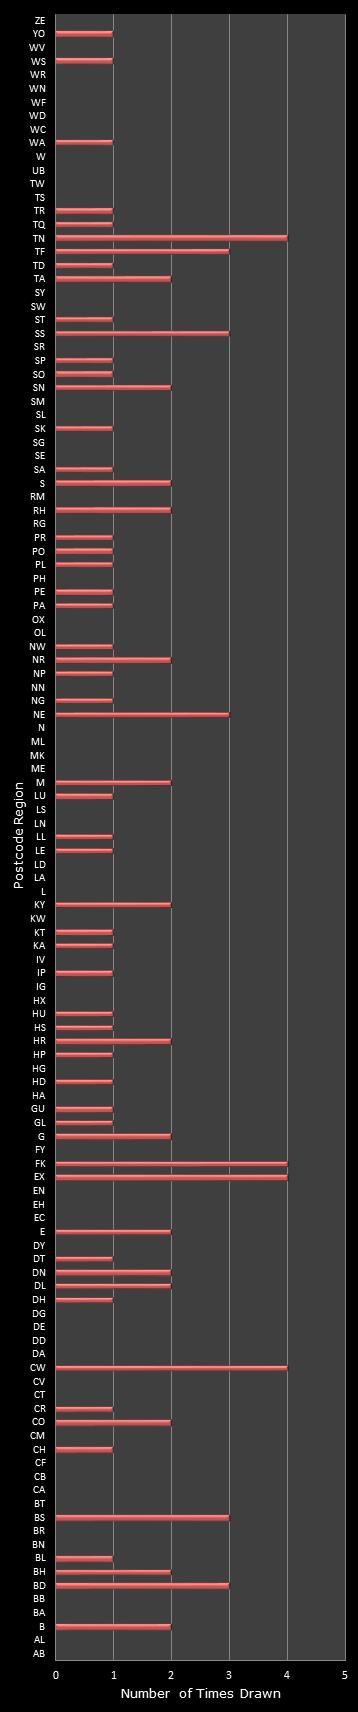
📊 Last 100 postcodes Number of times drawn - Winning postcodes
Winning postcodes - Statistics
Most picked Least picked Most overdue Least overdue Postcode Freq. Postcode Freq. Postcode Draws Postcode Draws CW 4 AB 0 AB 100 BA 0 EX 4 AL 0 AL 100 BH 1 FK 4 BA 0 BB 100 BN 2 TN 4 BB 0 BL 100 DA 4 BD 3 BN 0 BR 100 DH 5 BS 3 BR 0 BT 100 EH 6 NE 3 BT 0 CA 100 EX 7 SS 3 CA 0 CB 100 G 8 TF 3 CB 0 CF 100 HD 9 B 2 CF 0 CM 100 L 10
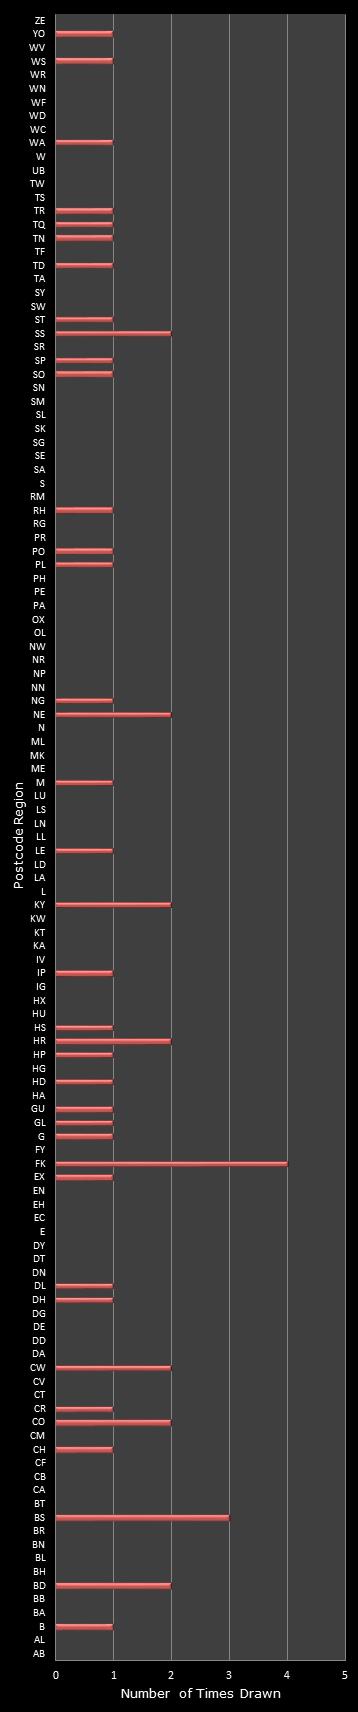
📊 Last 50 postcodes Number of times drawn - Winning postcodes
Winning postcodes - Statistics
Most picked Least picked Most overdue Least overdue Postcode Freq. Postcode Freq. Postcode Draws Postcode Draws FK 4 AB 0 AB 50 BA 0 BS 3 AL 0 AL 50 BH 1 BD 2 BA 0 BB 50 BN 2 CO 2 BB 0 BL 50 DA 4 CW 2 BH 0 BR 50 DH 5 HR 2 BL 0 BT 50 EH 6 KY 2 BN 0 CA 50 EX 7 NE 2 BR 0 CB 50 G 8 SS 2 BT 0 CF 50 HD 9 B 1 CA 0 CM 50 L 10
Top Prize £1,000 Weekday Daily Draw